Product Information Manager : System Diagnostics
Access
To access System Diagnostics tools, click
 -
> System -
>
System Diagnostics (under the
System Reports section).
-
> System -
>
System Diagnostics (under the
System Reports section).
Contents
Overview
System Diagnostics page can be used to perform the tasks like Ping, Trace, Database Performance etc., that are available on the respective tabs.
Listed below are the tasks available on this page with sample inputs and resulting outputs.
All tasks can be either executed immediately or scheduled. To schedule a repeat of any task, choose the
Repeat count and enter the
Repeat interval in seconds and click
 .
.
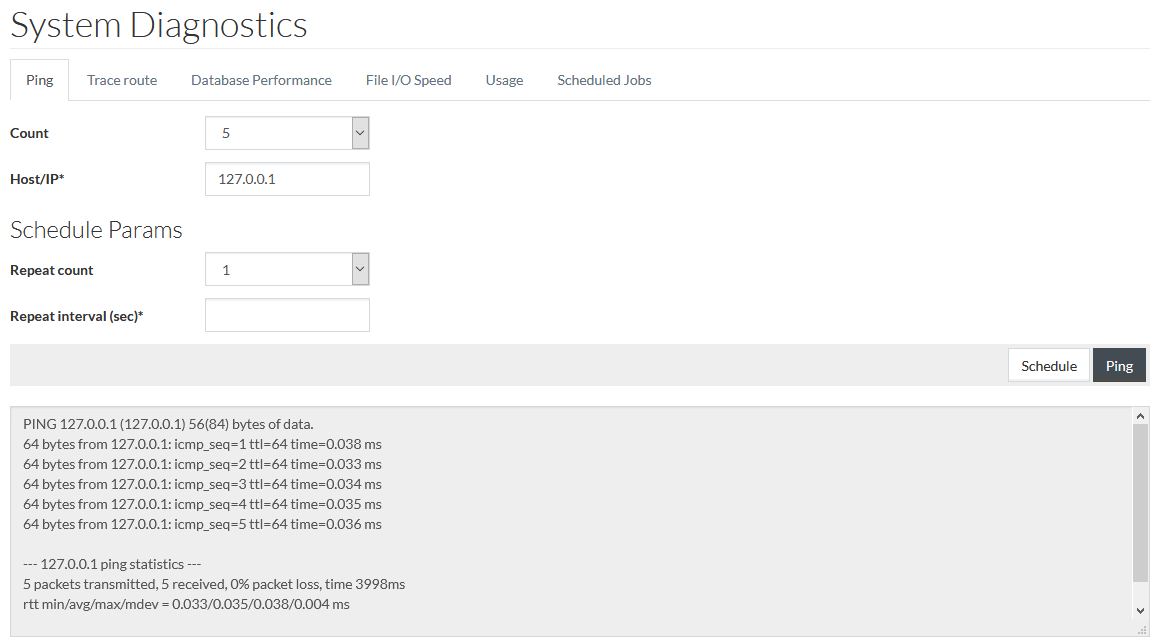
Ping
Use the Ping tab to check the ping statistics.
Choose the required ping
Count, enter the
Host/IP (mandatory field) and click
 .
.
Sample of the output for the Ping command for the specified Host/ID is shown below.
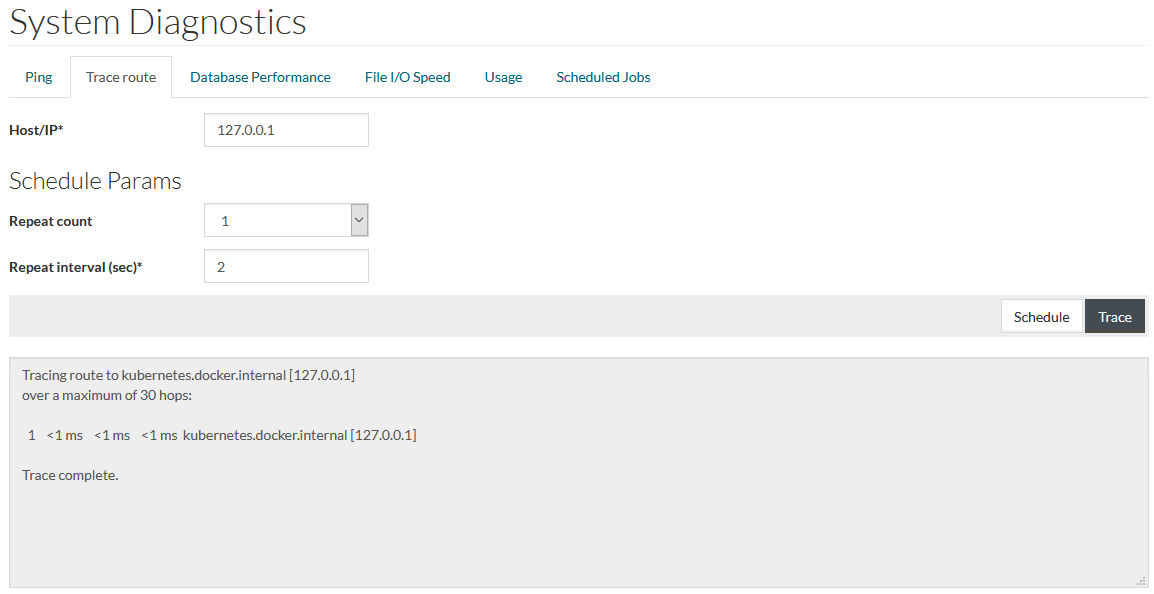
Trace Route
Trace route tab is used for displaying the route and measuring transit delays of packets across the network.
Enter the
Host/IP (mandatory field) and click
 .
.
Sample of the output for the Trace command for the specified Host/IP is shown below.
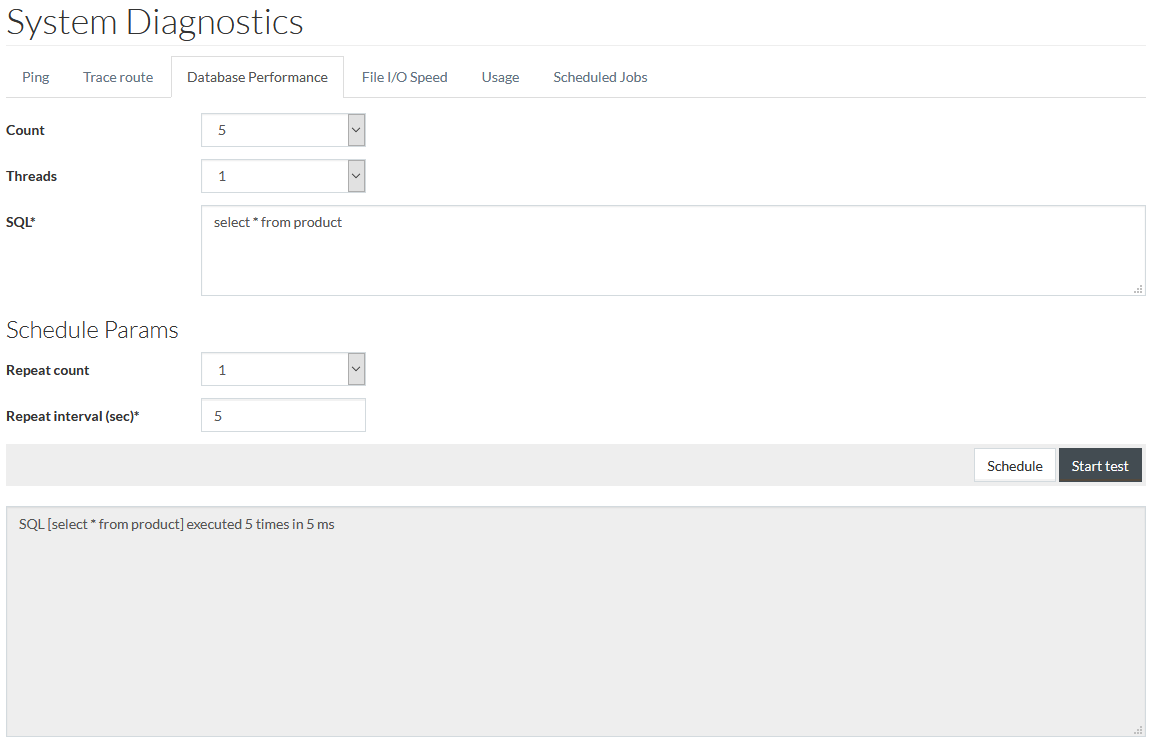
Database Performance
Database Performance tab is used to measure the performance of the database by executing SQL statements repeatedly and in a specified number of threads.
Select the required
Count and the number of
Threads, enter the
SQL statement and click
 .
.
Sample of the output for the SQL Query is shown below.
File I/O Speed
File I/O Speed tab is used for measuring the File I/O speed of the system.
Choose the number of times this test should be executed in
Test Quantity and click
to
start execution as shown below.
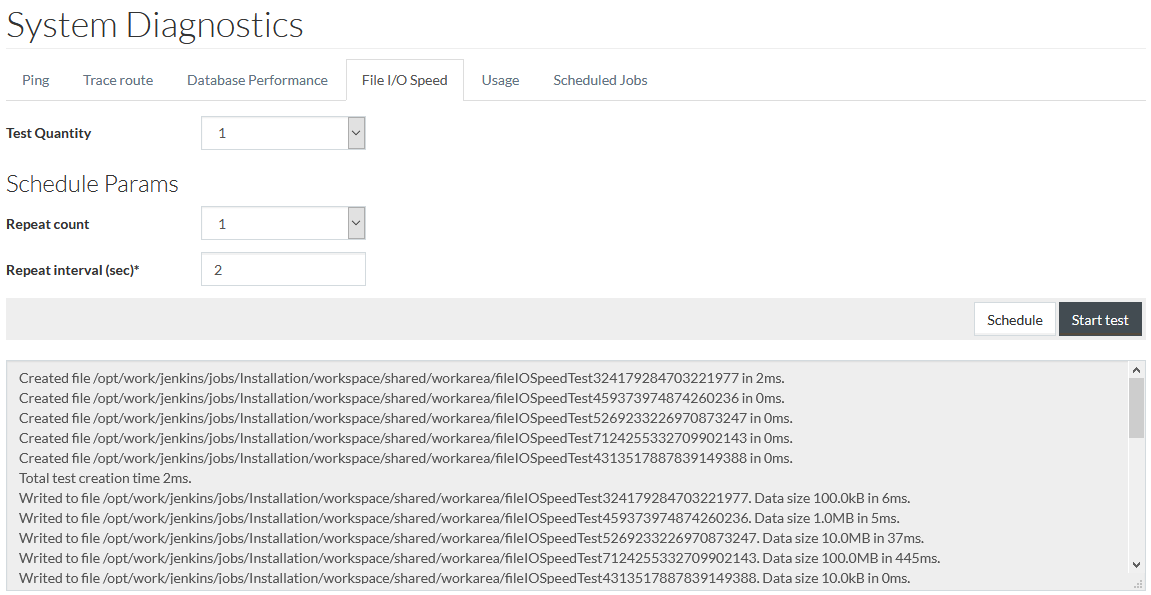
Sample of the output containing reading and writing time for different files is as shown above.
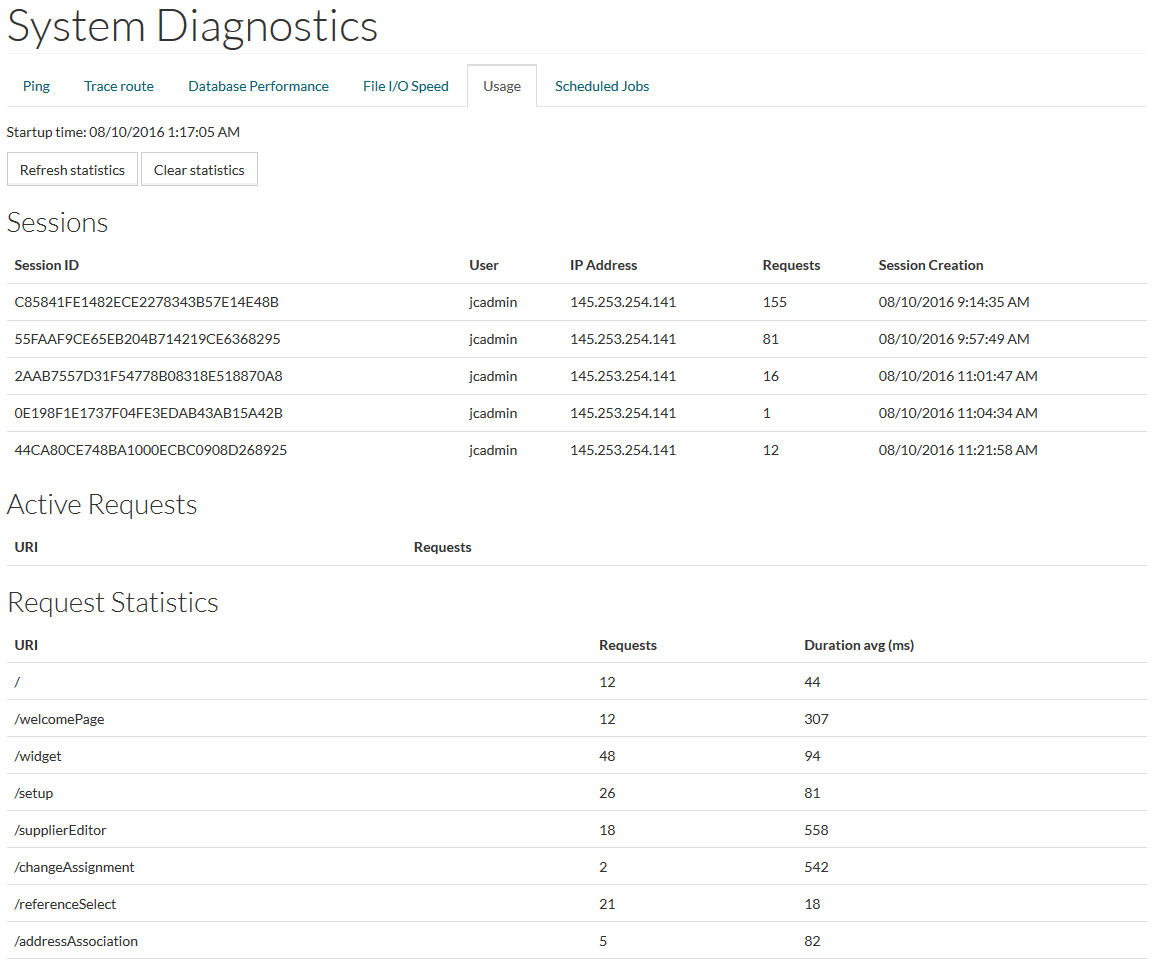
Usage Statistics
Usage tab allows to view/refresh/clear usage statistics. There are three tables with data for:
- Sessions - this section displays the information for open sessions.
- Active Requests - this section displays a list of active users grouped by URI.
- Requests Statistics - this section displays the requests count and average duration of each request for every URI.
Scheduled Jobs
Scheduled Jobs tab allows to view all jobs scheduled from the System Diagnostics page.
Every time you click
on other tabs of this page, you are redirected to the
Scheduled Jobs tab where it is possible to stop job execution.
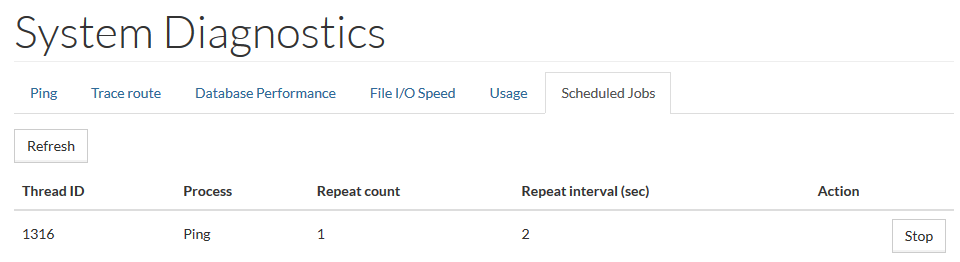
Click the
 button to refresh the scheduled Jobs list.
Click the
 button to stop the execution of the scheduled Jobs.